Stage 1 - Rapidly growing

|
Stage 2 - Slowly growing

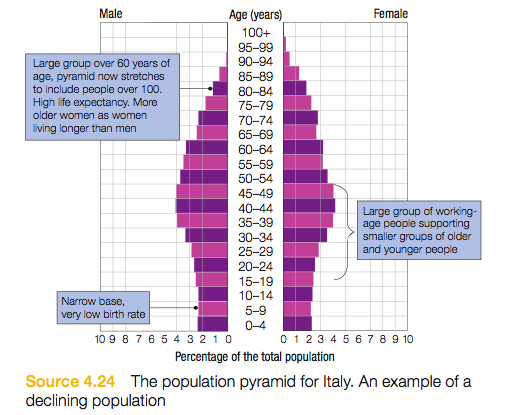
Stage 3 - declining
|
LESSON 3
Questions about population pyramids
|
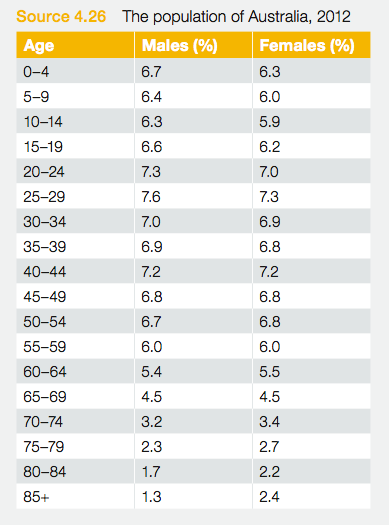
Write a summary of the situation for Australia in relation to its population. Use the following to guide your answer:
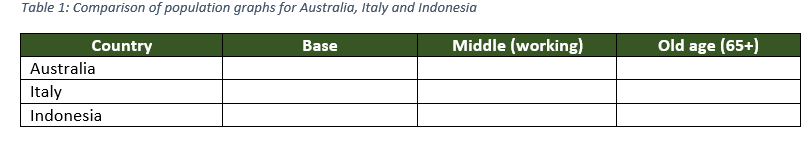
1. Is Australia's population growing and if so is it rapid or slow? 2. How is our population different from that of Indonesia and Italy? Compare these countries in a table like the one below. Comment of the key differences in shape of the graphs. 3. According to the data you have constructed, does Australia have a good working population compared to the other countries? Explain how you know this. 4. If countries like Japan and Italy continue to grow older, predict and describe what might happen to their health system and to their economy. 5. What does a high birth rate and low life expectancy mean for a country's population growth? |
Explanation of the population pyramids and how to analyse them.
|
COMPARING CHANGE FROM 2011 - 2016
1. What age had the highest population in it in 2011?
2. What age group was the highest in percentage in 2016?
3. Which age group has had the highest growth and what was the percentage was the growth?
4. Describe what is happening to the growth rate of middle aged workers (35-44)
2. What age group was the highest in percentage in 2016?
3. Which age group has had the highest growth and what was the percentage was the growth?
4. Describe what is happening to the growth rate of middle aged workers (35-44)
